My Work

Projects & Case Studies

Data analytics, machine learning, business intelligence, software development and infrastructure. Each project started with a different problem, from making sense of historical datasets to building software a business runs on every day.

Data Science · Machine Learning

Municipal Election Outcome Intelligence

What can historical election data tell us before the votes are counted?

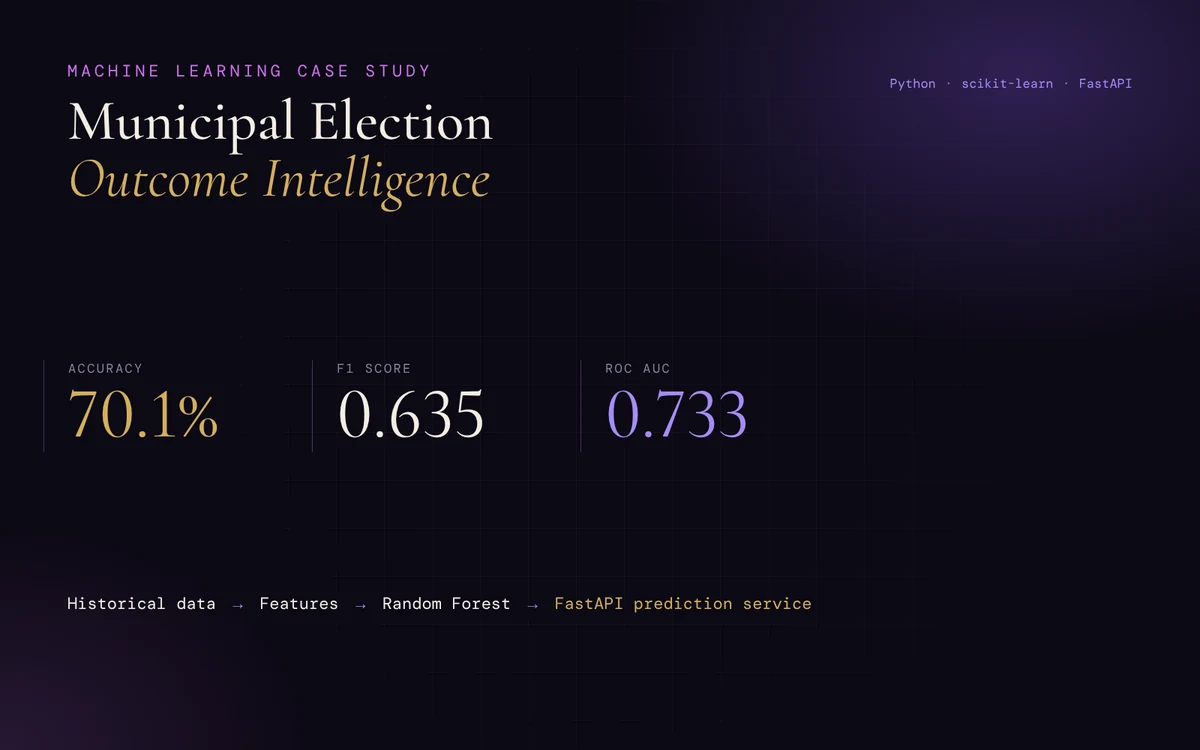
I built a machine learning workflow on the Canadian Municipal Elections Database, 123,416 candidate records, to test whether information available before an election can estimate a candidate’s chance of being elected. The goal was an honest estimate, so a large part of the work was making sure the model never saw the answer.

Key technical work
  • Cleaned and filtered the records to 91,768 contested races
  • Removed vote totals and other outcome-leaking fields to keep results realistic
  • Compared Logistic Regression and Random Forest against a majority class baseline
  • Used grouped cross validation so candidates from one race never split across folds
  • Built a FastAPI service that returns a prediction and a probability for a new candidate
70.1%Accuracy
0.635F1 score
0.733ROC AUC

Evaluated on 7,911 candidates from 2022 elections the model never trained on.
PythonPandasscikit-learnRandom ForestFastAPIJupyter
Municipal Election Outcome Intelligence: 70.1% accuracy, 0.635 F1, 0.733 ROC AUC; pipeline from historical data to a FastAPI prediction service
Business Intelligence · Power BI

Adult Income Intelligence

How does the share earning above $50K differ across groups?

A four-page interactive Power BI report on 32,561 records from the 1994 U.S. Census, built with Power Query and DAX. The key numbers were checked against a separate Pandas analysis of the same dataset.

Key technical work
  • Cleaned the data in Power Query, keeping missing values as "unknown" instead of deleting 2,399 rows
  • DAX measures that compare rates within each group, so large and small groups compare fairly
  • Executive insights written in DAX, with no AI, that rewrite themselves as the filters change
  • Validated the results against a Pandas analysis of the same data
Observed in the 1994 dataset
48.5%Bachelor's or higher
vs 13.0% high school or less
30.6%Men above $50K
vs 10.9% of women
45–54Peak age group
at 40.1%
Power BIPower QueryDAXPandas

All four report pages. Click any page to enlarge.

LiveAI-Powered Business Intelligence · Full-Stack

NUNAKI Command Center

Business data you can simply ask questions of.

Small businesses have the data but rarely the time to dig through reports. I designed and built a business intelligence platform that brings revenue, refunds, products, locations and staff performance into one dashboard. Its AI analyst works on the business’s own data, so a user can ask a question in everyday language and get a calculated answer instead of writing a query.

Key technical work
  • Interactive dashboards for financial and operational reporting by period and location
  • Flask backend with client-specific MySQL databases and data mapping
  • AI integration that answers natural-language questions and writes business briefings
  • Filtering, CSV and Excel upload handling, and one-click PDF report export
  • Deployed and maintained on Railway
How it fits together
Browser→Flask→MySQL→Anthropic API→Dashboards & briefings
PythonFlaskMySQLChart.jsAnthropic APIReportLabRailway

Dashboard view with revenue, refunds, locations and the AI Briefing panel.

LiveWebsite & Operations Dashboard

Highway Windows

From scattered records to one operations system.

As operations manager at Highway Windows, I saw how customers, quotes, jobs and costs were spread across separate records, which made it hard to see what was owed, what was booked and how the business was doing. I architected and deployed the company website alongside a secure internal operations dashboard that brings all of that into one place.

Company website

Designed, built and deployed the public-facing site.

Operations dashboard

Consultations, jobs, appointments, direct costs, suppliers and customer balances in one secure system.

Key technical work
  • Designed the database around how the business runs a job, from consultation to install
  • Overview of money owed, quoted work and active jobs at login
  • Performance reporting on collected revenue, expenses and company output
  • Appointment, installation and supplier tracking
ReactViteNode.jsExpressMySQLNetlifyRailway

Operations dashboard home screen, shown with illustrative demo data to protect business information.

BetaFull-Stack Development · Web Application

FARRIN

A social discovery platform for the Caribbean community and its diaspora.

I founded FARRIN and built it end to end as its sole developer: architecture, backend services, database structure, user experience and integrations. Most apps stop at a user’s city, so the core challenge was discovery across countries, with verified profiles and a secure path from sign up to paid membership.

Key technical work
  • User registration, authentication and phone verification
  • Profile discovery across countries, with story prompts and profile visitors
  • Messaging and video dates
  • Selfie verification and photo moderation with AWS Rekognition
  • Membership subscriptions through PayPal, installable as a progressive web app
Node.jsExpressMySQLPayPalAWS RekognitionTwilioCloudinary
Additional Work

More technical experience

A live Python analytics dashboard, data preparation tooling, and the infrastructure, monitoring and security work behind production systems.

LiveData Analytics · Python Dashboard
E-Commerce Intelligence

An interactive dashboard I built from scratch in Python to explore 1,200 online orders: product performance, order outcomes, marketing channels, cart sizes and coupons. Every KPI and chart can be clicked for a deeper breakdown, and the findings update with the filters.

Chi-square tests showed cancellation and return rates (about 41%) did not differ meaningfully by product, channel, cart size or coupon. That points to a business-wide issue rather than one problem product.

PythonPandasPlotlyStreamlitSciPy

The live dashboard may take up to a minute to wake up.

Infrastructure & Security

Built during my DevOps internship at DigifySEO, on a Debian VPS running containerized production services.

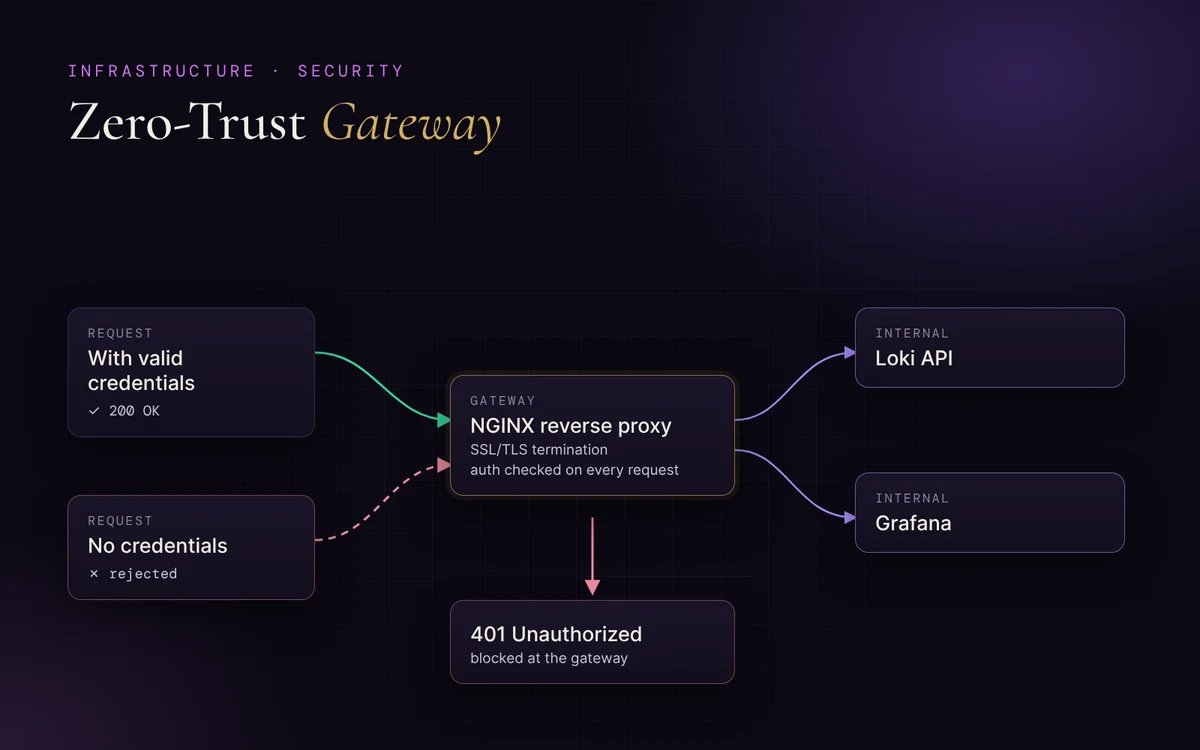
Diagram: requests with credentials pass through the NGINX gateway to internal Loki and Grafana; requests without credentials are blocked with 401 Unauthorized
Security · NGINX
Zero-Trust Gateway
  • Problem: internal monitoring APIs could be reached by anyone who found the endpoint.
  • Solution: an NGINX reverse proxy with SSL/TLS termination that checks credentials on every request before anything reaches an internal service.
  • Result: unauthenticated requests are rejected at the gateway with 401 Unauthorized, confirmed in the live access logs.
NGINXSSL/TLSDocker
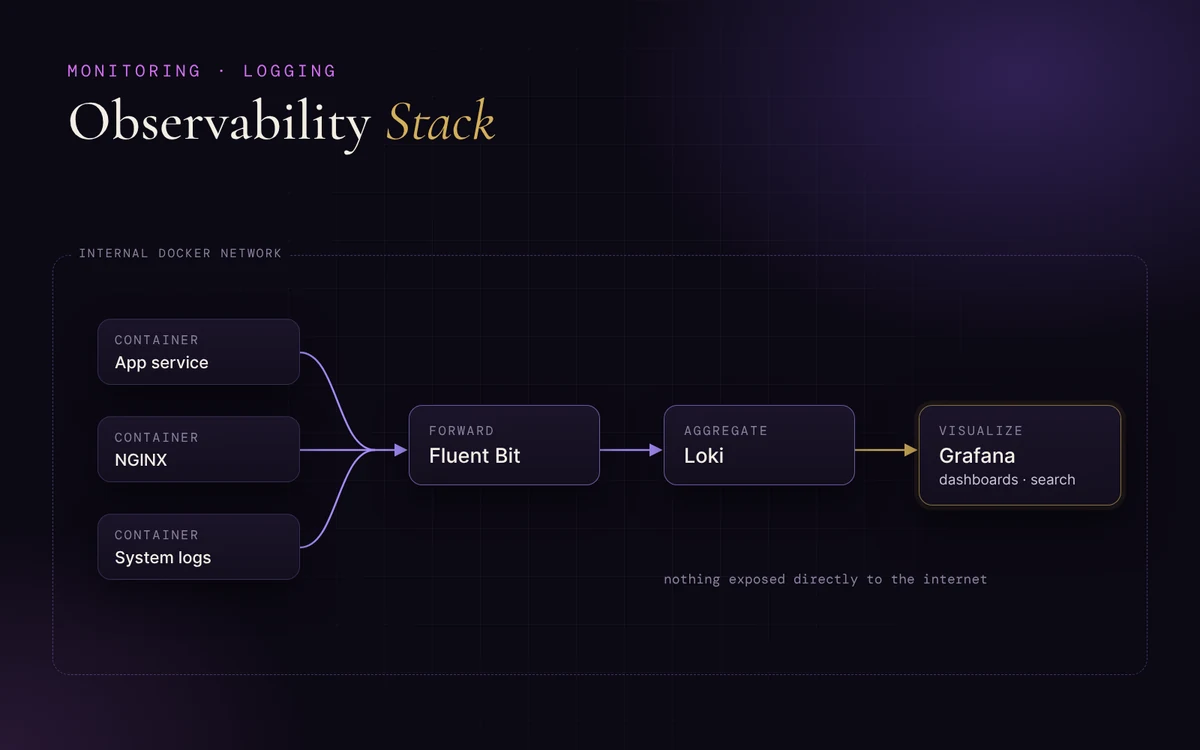
Diagram: container logs flow through Fluent Bit to Loki and into Grafana dashboards, all on an internal Docker network
Monitoring · Logging
Observability Stack
  • Problem: logs were scattered across containers, so tracking down an issue meant checking each service one by one.
  • Solution: Fluent Bit forwards container logs to Loki for aggregation, with Grafana dashboards on top, all on an internal Docker network behind NGINX.
  • Result: one place to search logs and watch service health, with nothing exposed directly to the internet.
GrafanaLokiFluent BitDocker
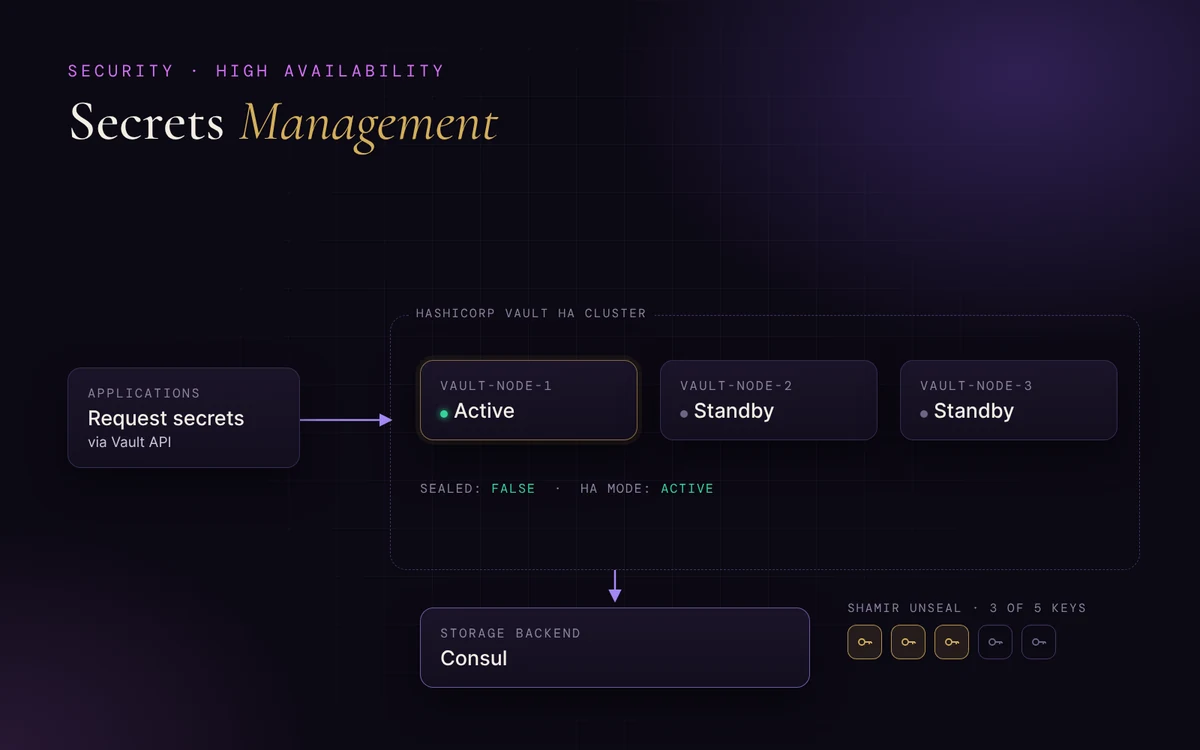
Diagram: applications request secrets from a three-node HashiCorp Vault cluster, one active and two standby, backed by Consul and unsealed with three of five Shamir keys
Security · High Availability
Secrets Management with HashiCorp Vault
  • Problem: passwords, API keys and certificates needed a secure home instead of sitting in configuration files.
  • Solution: a three-node HashiCorp Vault high-availability cluster backed by Consul, protected by a Shamir seal that needs three of five key holders to unlock.
  • Result: secrets served from an active cluster that stays available if a node goes down.
HashiCorp VaultConsulDocker
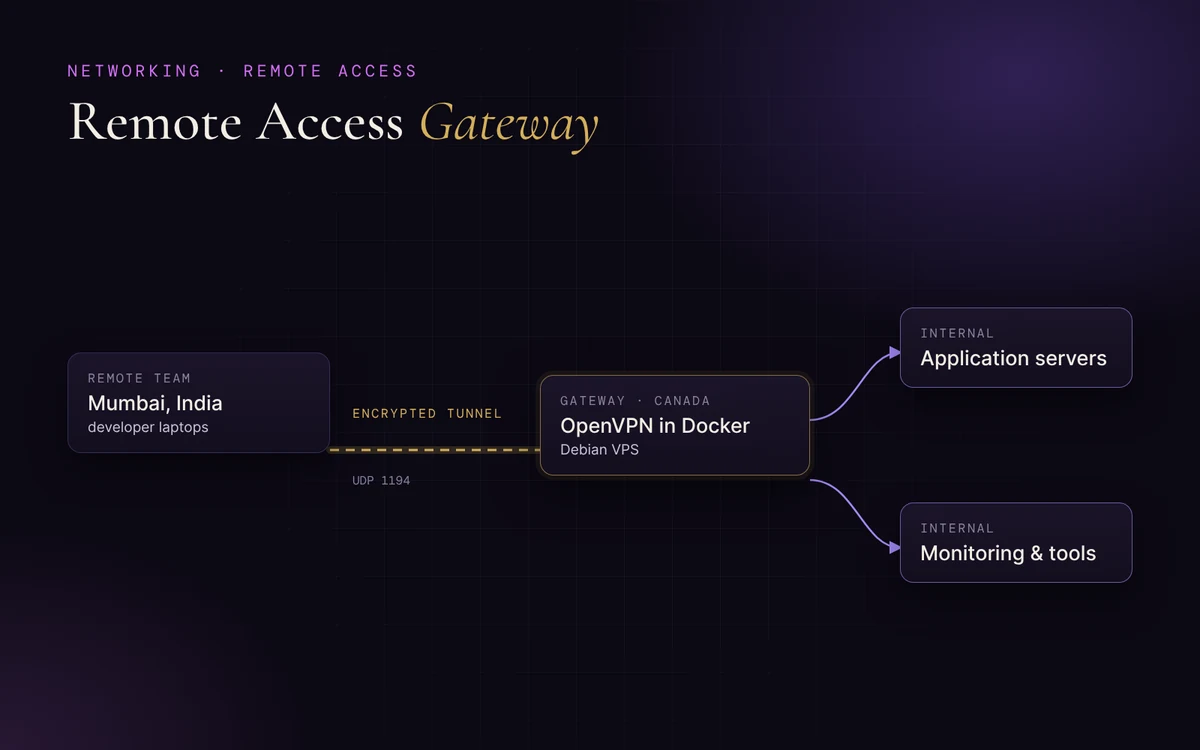
Diagram: a remote team in Mumbai connects through an encrypted OpenVPN tunnel on UDP 1194 to a Dockerized gateway on a Debian VPS in Canada, which reaches internal servers
Networking · Remote Access
Remote Access Gateway
  • Problem: a development team in Mumbai needed secure access to servers hosted in Canada.
  • Solution: a Dockerized OpenVPN gateway on a Debian VPS, with UDP port 1194 mapped and all traffic encrypted end to end.
  • Result: the remote team connects securely to the Canadian environment without any internal service being exposed publicly.
OpenVPNDockerDebianLinux

Interested in my work?

I’m open to technical roles, collaborative projects and opportunities in data, AI and software development.